

The pane's tabs
Nine tabs, each a view of the graph: 1–9 switches between them, or a click on one.
Overview
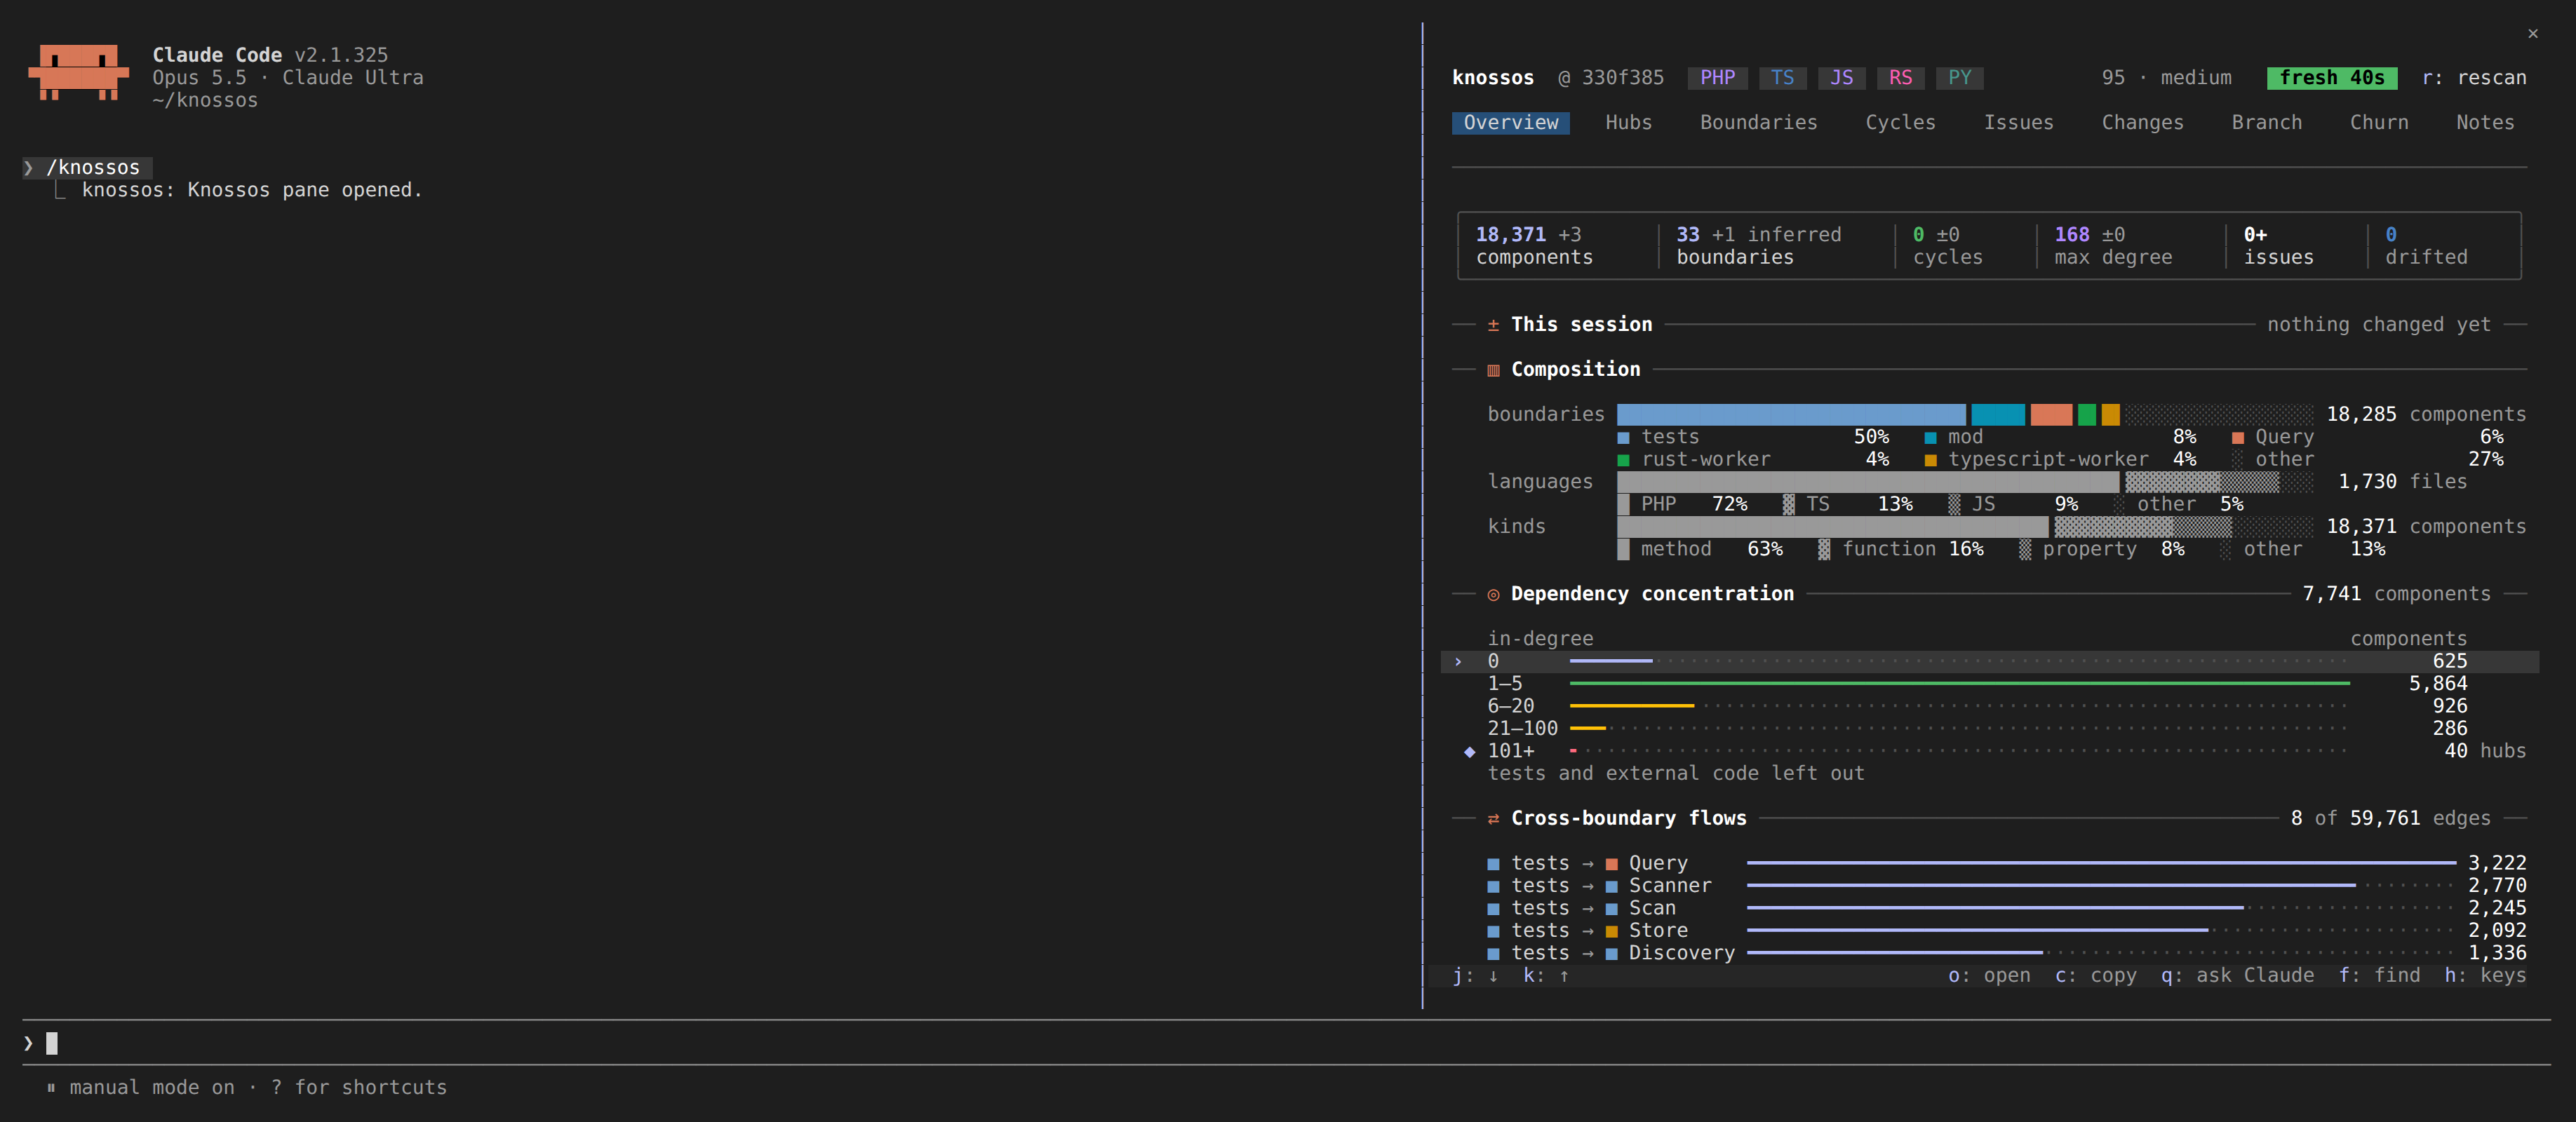
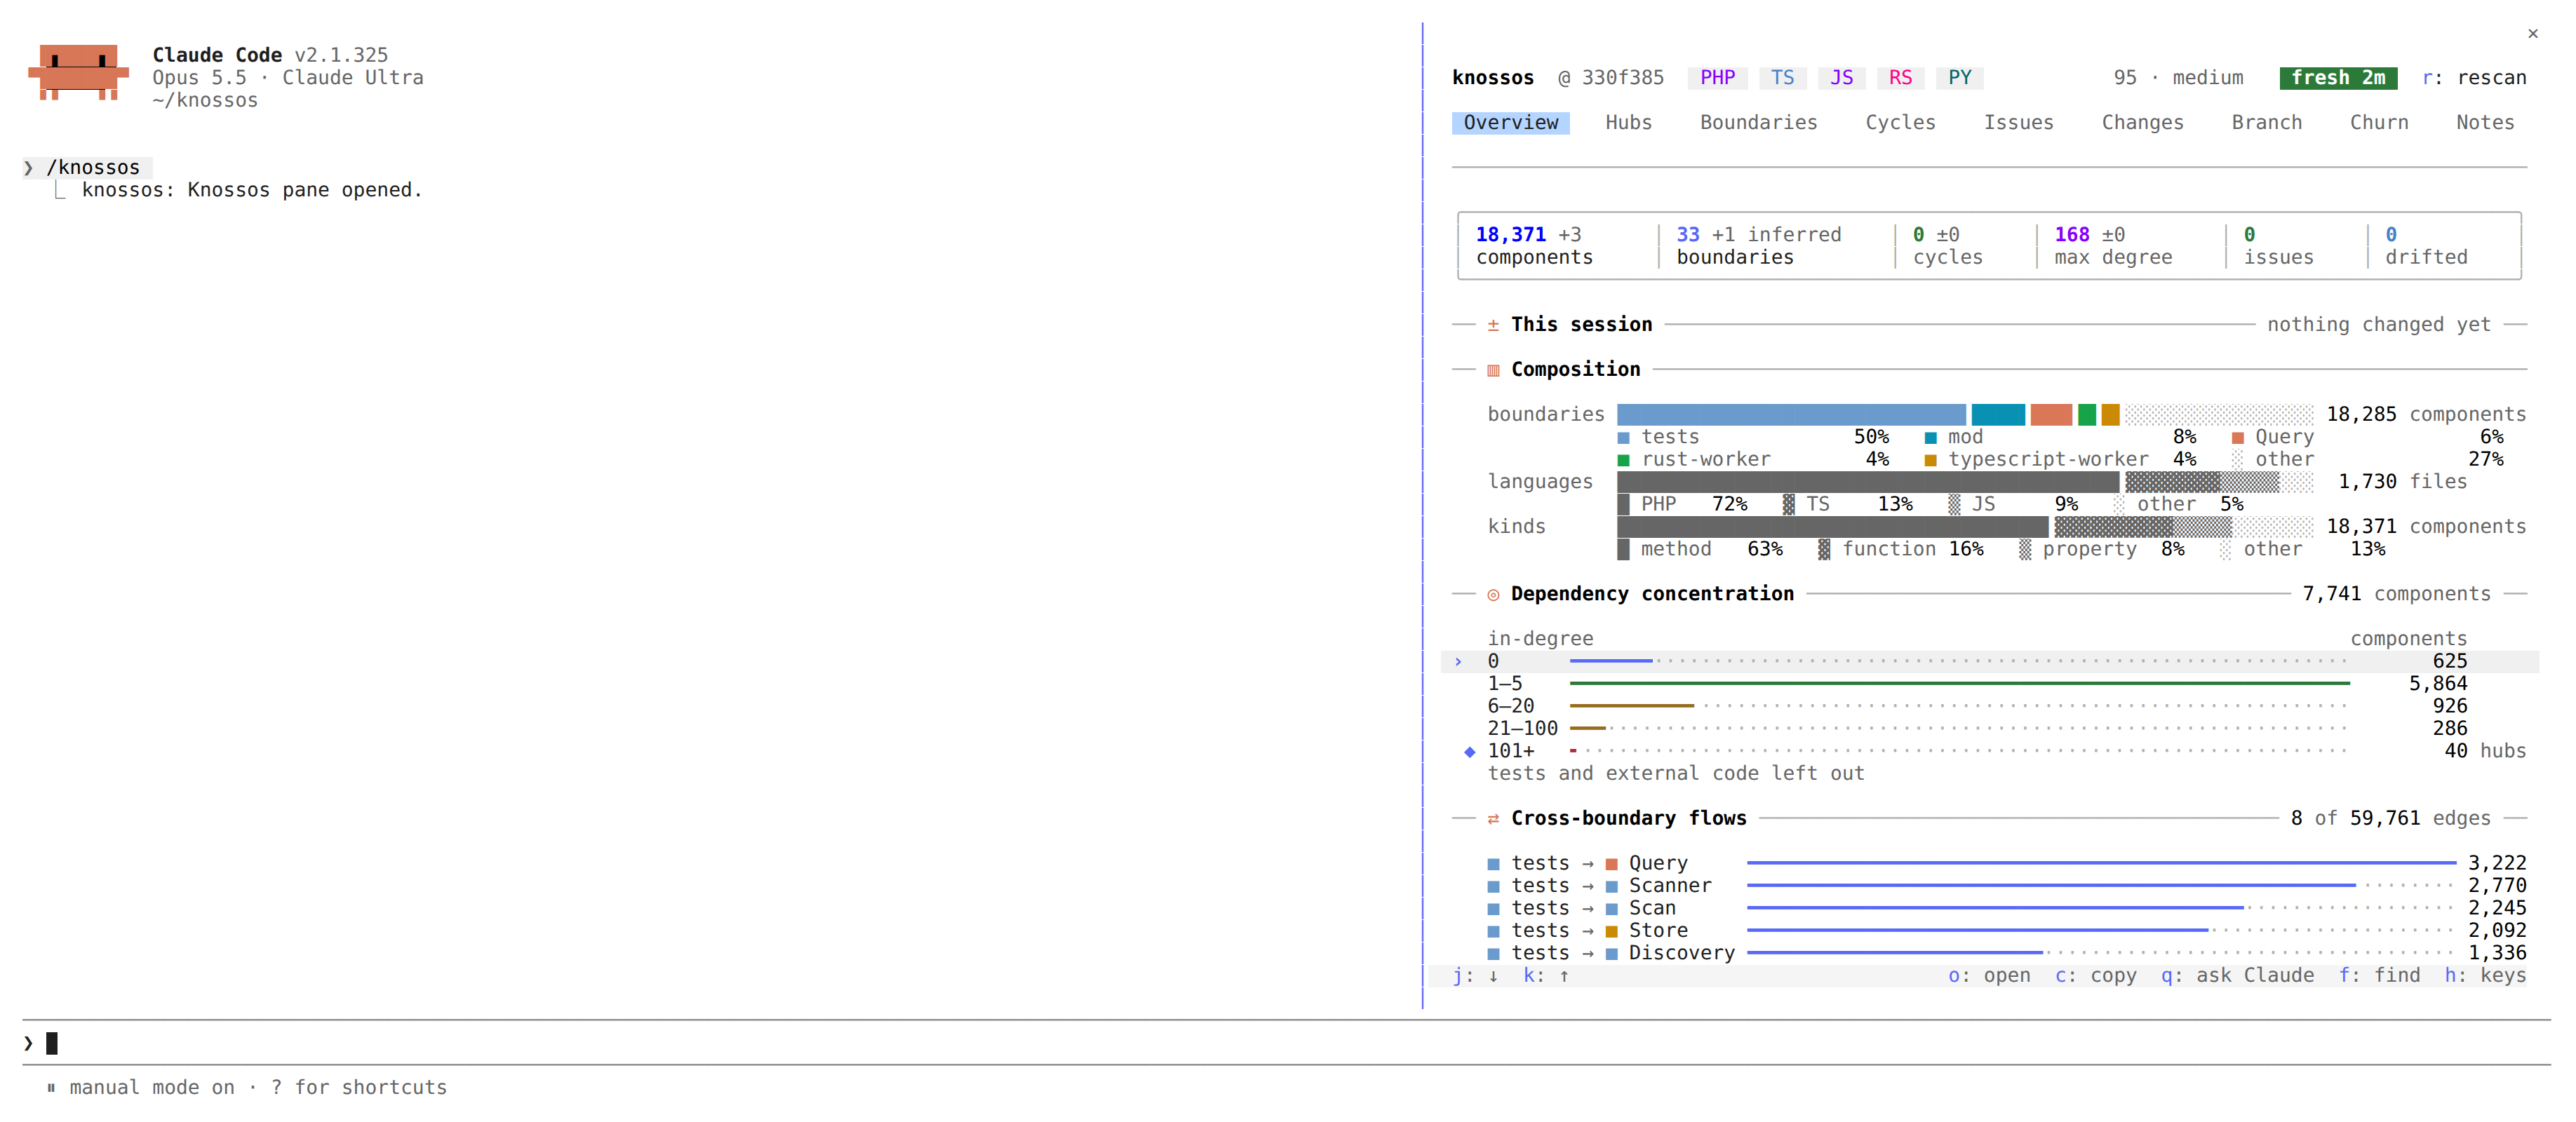
Overview measures the project; the lists are on the other tabs.
The stat tiles across the top: components, boundaries, cycles, max degree, dead code, diagnostics, policy and drifted. Beside a figure, how it moved since the snapshot retained before this one (▲1,788, ▼1, ±0). A figure that deviates is coloured: cycles and diagnostics above zero in the warning colour, policy violations in the error colour, drifted files in the accent. The cycles figure counts cycles between types only; the ones that stay inside one type show on the Cycles tab alone. A tile draws its trend as a sparkline when it has room and five or more snapshots move. dead code counts the candidates the Issues tab lists and has no delta. boundaries counts the boundaries you declare in knossos.json. Beside it, a dim +6 inferred counts the inferred boundaries that hold components none of yours covers, so the two figures add up to what the Boundaries tab lists. The note shows only when such a boundary exists, and goes first when the tiles run out of room. Without a declared boundary the figure counts the inferred ones and has no note. The drifted label is a button that lists the drifted files, as d does. The labels of the other figures that count a list are buttons too, each opening the tab that lists them with the marker on the first item: components opens Hubs, boundaries opens Boundaries, cycles opens Cycles, and policy, diagnostics and dead code open Issues on their first violation, diagnostic or candidate. When Issues lists none of what the figure counts (a policy total whose violations are all +N more, say), the tab opens at its top with the marker on its first row, whichever kind that is. At zero there is nothing to list, and the label is plain. max degree is a single figure, so it is always plain.
This session: the session's scans as a row of dots, how many files it touched, their dependents and the tests that reach them (within six hops), with a warning when no test does. A warning about files no test reaches is a button: it opens Changes with only those files listed, as u does. The marker starts on the way to the Changes tab. t copies the tests' command. Before anything changed it is one line, nothing changed yet.
Composition: what the project is made of, as a 100 percent stacked bar per dimension. Components by boundary, each in its colour, the five largest named and the rest as other. Files by language and components by kind, in one neutral ink told apart by texture (█ ▓ ▒, and ░ for the rest). The total stands right-aligned beside each bar, every part's share in a legend under it.
Dependency concentration: how many components have how many dependents, in five buckets of in-degree: 0, 1–5, 6–20, 21–100 and 101+. The top bucket is marked ◆ and counted as hubs. It counts every component the hub ranking could hold, tests and external code left out, and the title's total ends in + when that count was cut short. o on a bucket opens Hubs narrowed to it.
Health over time: one row each for cycles, gate unreferenced, max degree and diagnostics, every row a small chart on its own scale over the same snapshots, oldest on the left. The newest value stands at the right with its range, or no change. It appears from five retained snapshots on. gate unreferenced is the quality gate's count of components nothing references, which is wider than the dead-code tile, so the two differ by design.
A snapshot with more than 300,000 rows in one table is not read whole, so only what a count says is kept of it: components, relationships and diagnostics. Its cycles, gate unreferenced and max degree are not counted, those rows are left out, and the card says so in a line of its own, with the table and its rows when it is the live graph. The card then shows even without five snapshots, so a large graph is never silently without one.
Cross-boundary flows: the strongest dependencies from one boundary to another, ■ tests → ■ core with a bar and the count. A pair a declared policy forbids has its bar in the error colour and says × forbidden. o on a flow opens its cell on Boundaries.
On a tall pane, the rows left over go to two more lists: the complexity hotspots and the files most depended on, each opening its file's detail.
Notes: one line, how many notes the project holds and how many need you (142 notes · 3 missing · 5 stale · 1 flagged). o on it opens the Notes tab on the most pressing group: the missing, else the stale, else the flagged.
The marker walks the way to Changes, the buckets, the flows, then the notes.
Hubs
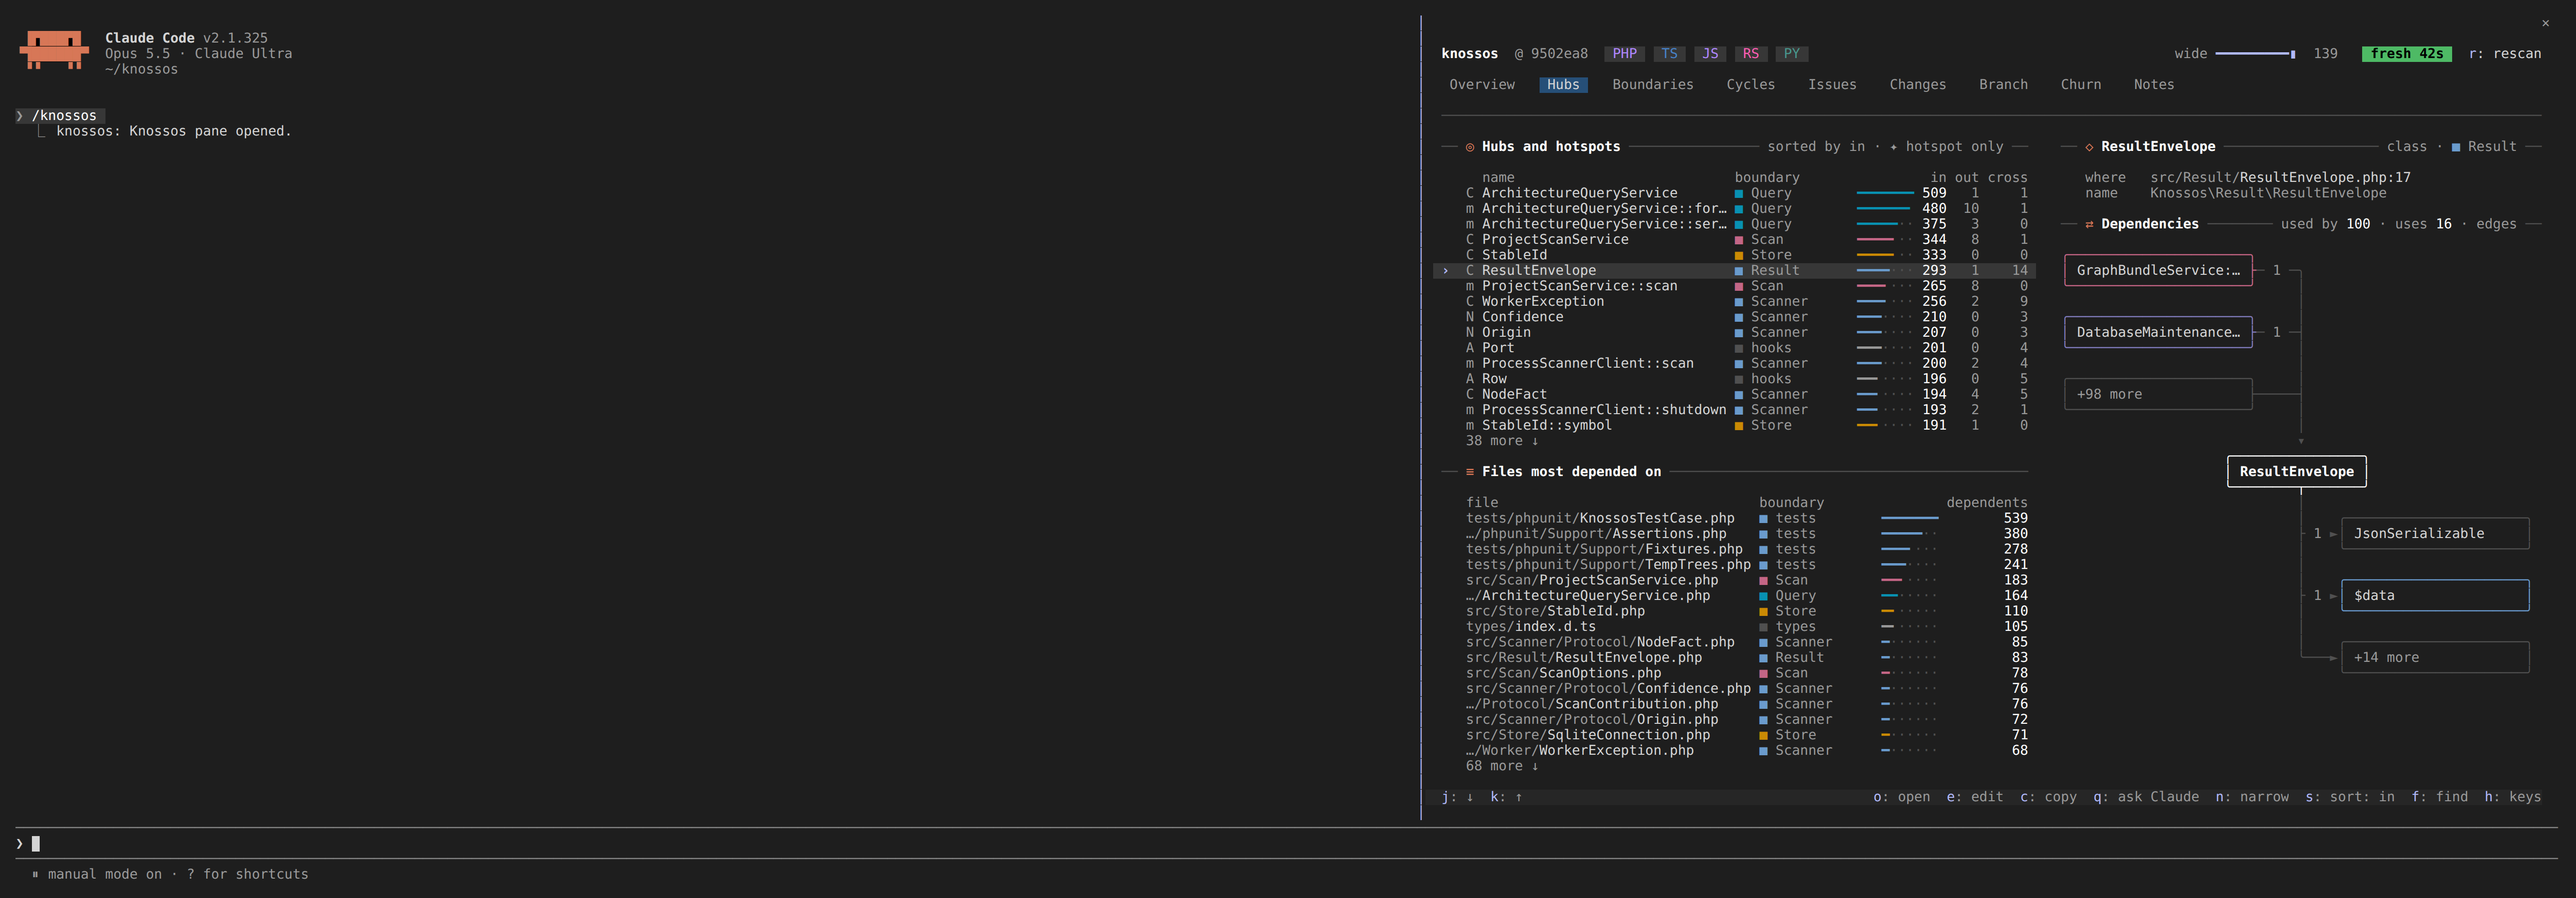
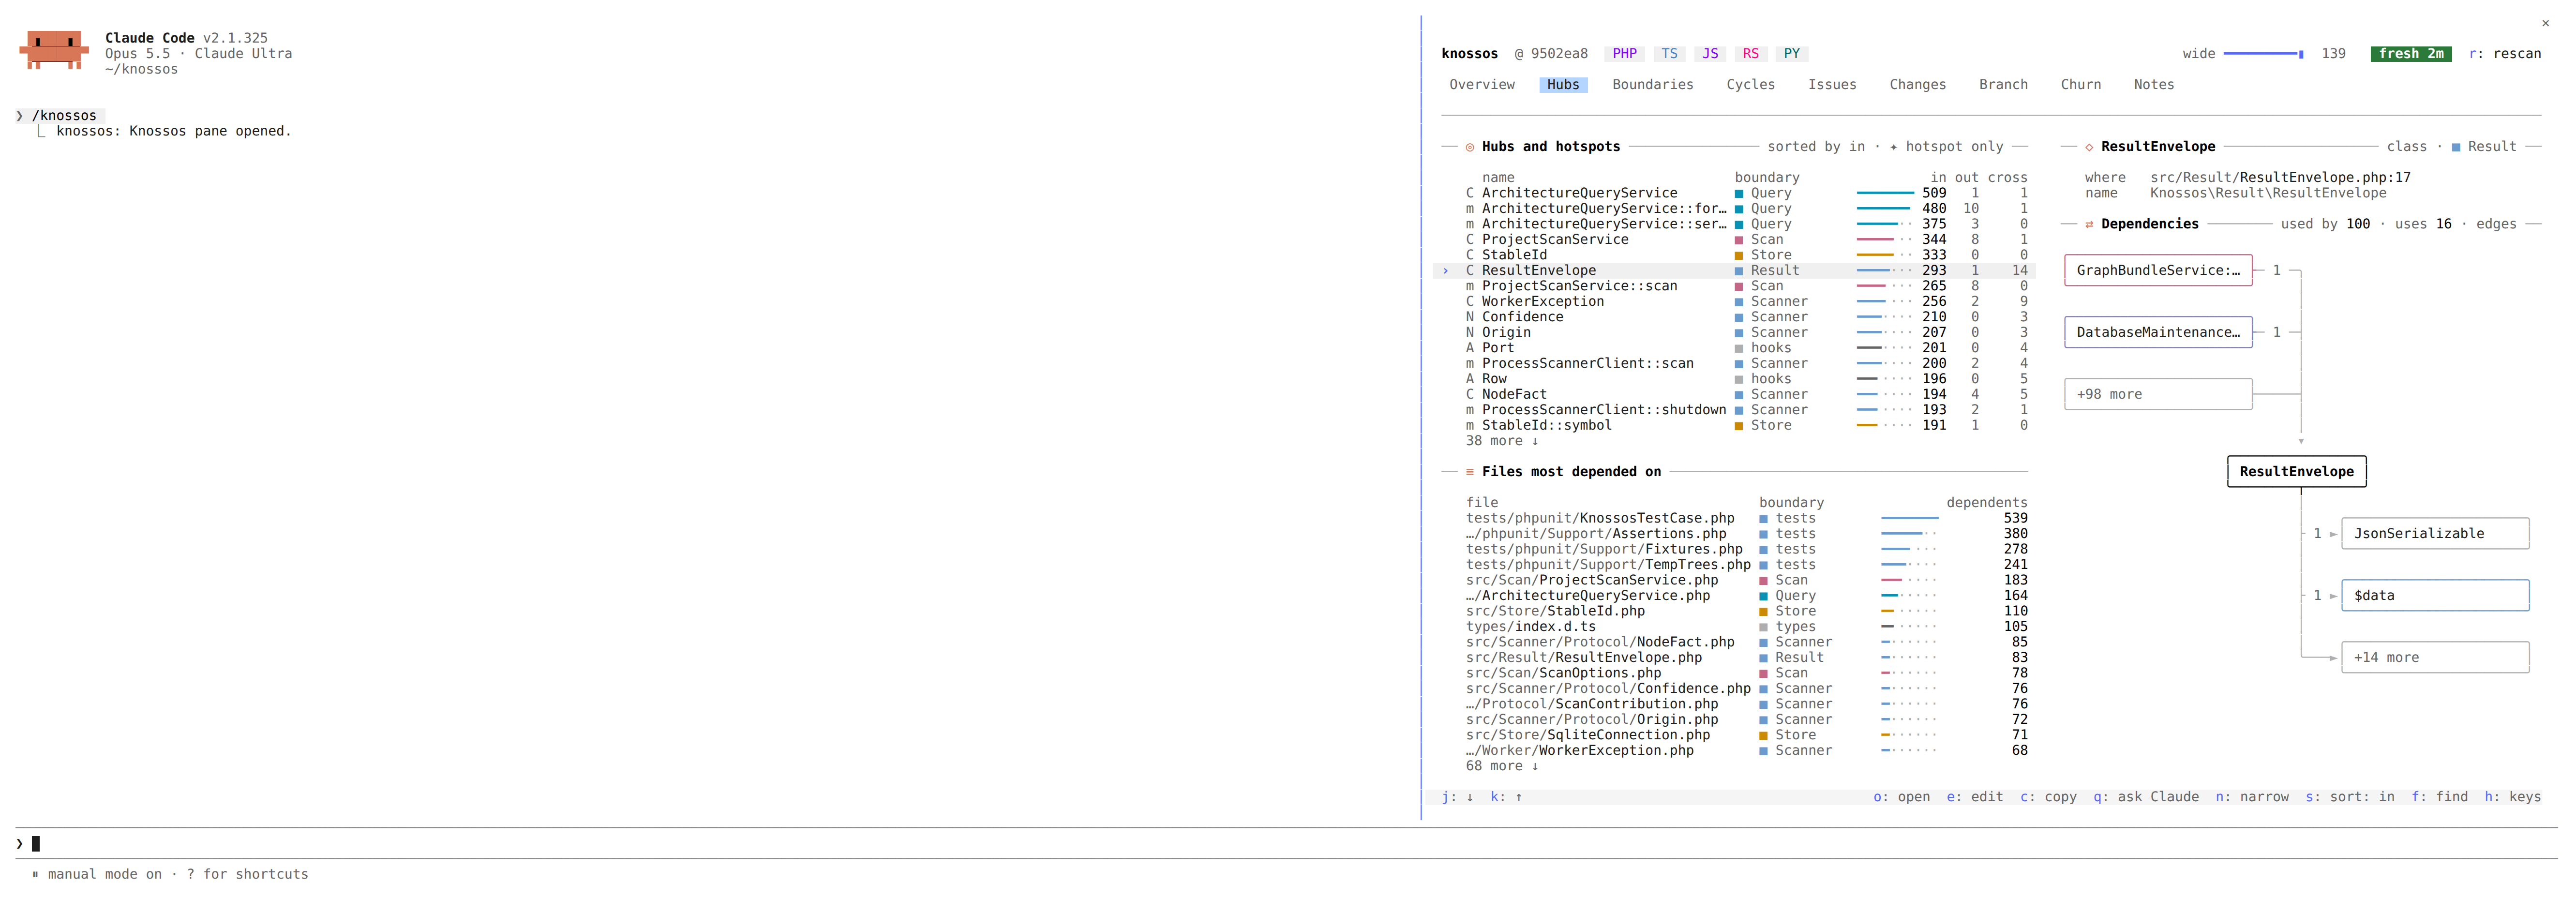
Hubs and hotspots lists the components most depended on, one row each, with its boundary and three degrees:
| column | meaning |
|---|---|
in | dependencies on it from other components |
out | its dependencies on other components |
cross | those of its dependencies, in or out, that cross a boundary |
The bar follows the sorted column, and the note at the right of the title says which (sorted by in). ◆ marks a hotspot that is not also a hub. Methods read Class::method. The list holds the fifty most depended on, and the note says partial when the walk that ranks them stopped at its time limit.
Beside it (below it on a narrower pane), Files most depended on lists files with how many files depend on each.
| key | what it does |
|---|---|
s | sort by in, out or cross degree in turn |
n | narrow both lists to names that hold what you type; Enter keeps the filter |
x | clear the filter, or the in-degree range an Overview bucket set |
o | open the marked component or file as its detail |
e | open the component's file at its declaration |
Opened from an Overview bucket, the list holds only the hubs in that range (in-degree 101+ · 26 listed of 27). The bucket may count more than the list holds.
Rest the pointer on a name (where the surface has a pointer) to see a card without opening anything: the name and boundary, how many files depend on it, a component's in- and out-degree, and the three files that depend on it most.
On a wide pane the marked row's detail stands beside the lists, as in the still: here ResultEnvelope, used by 89 and using 15.
Boundaries
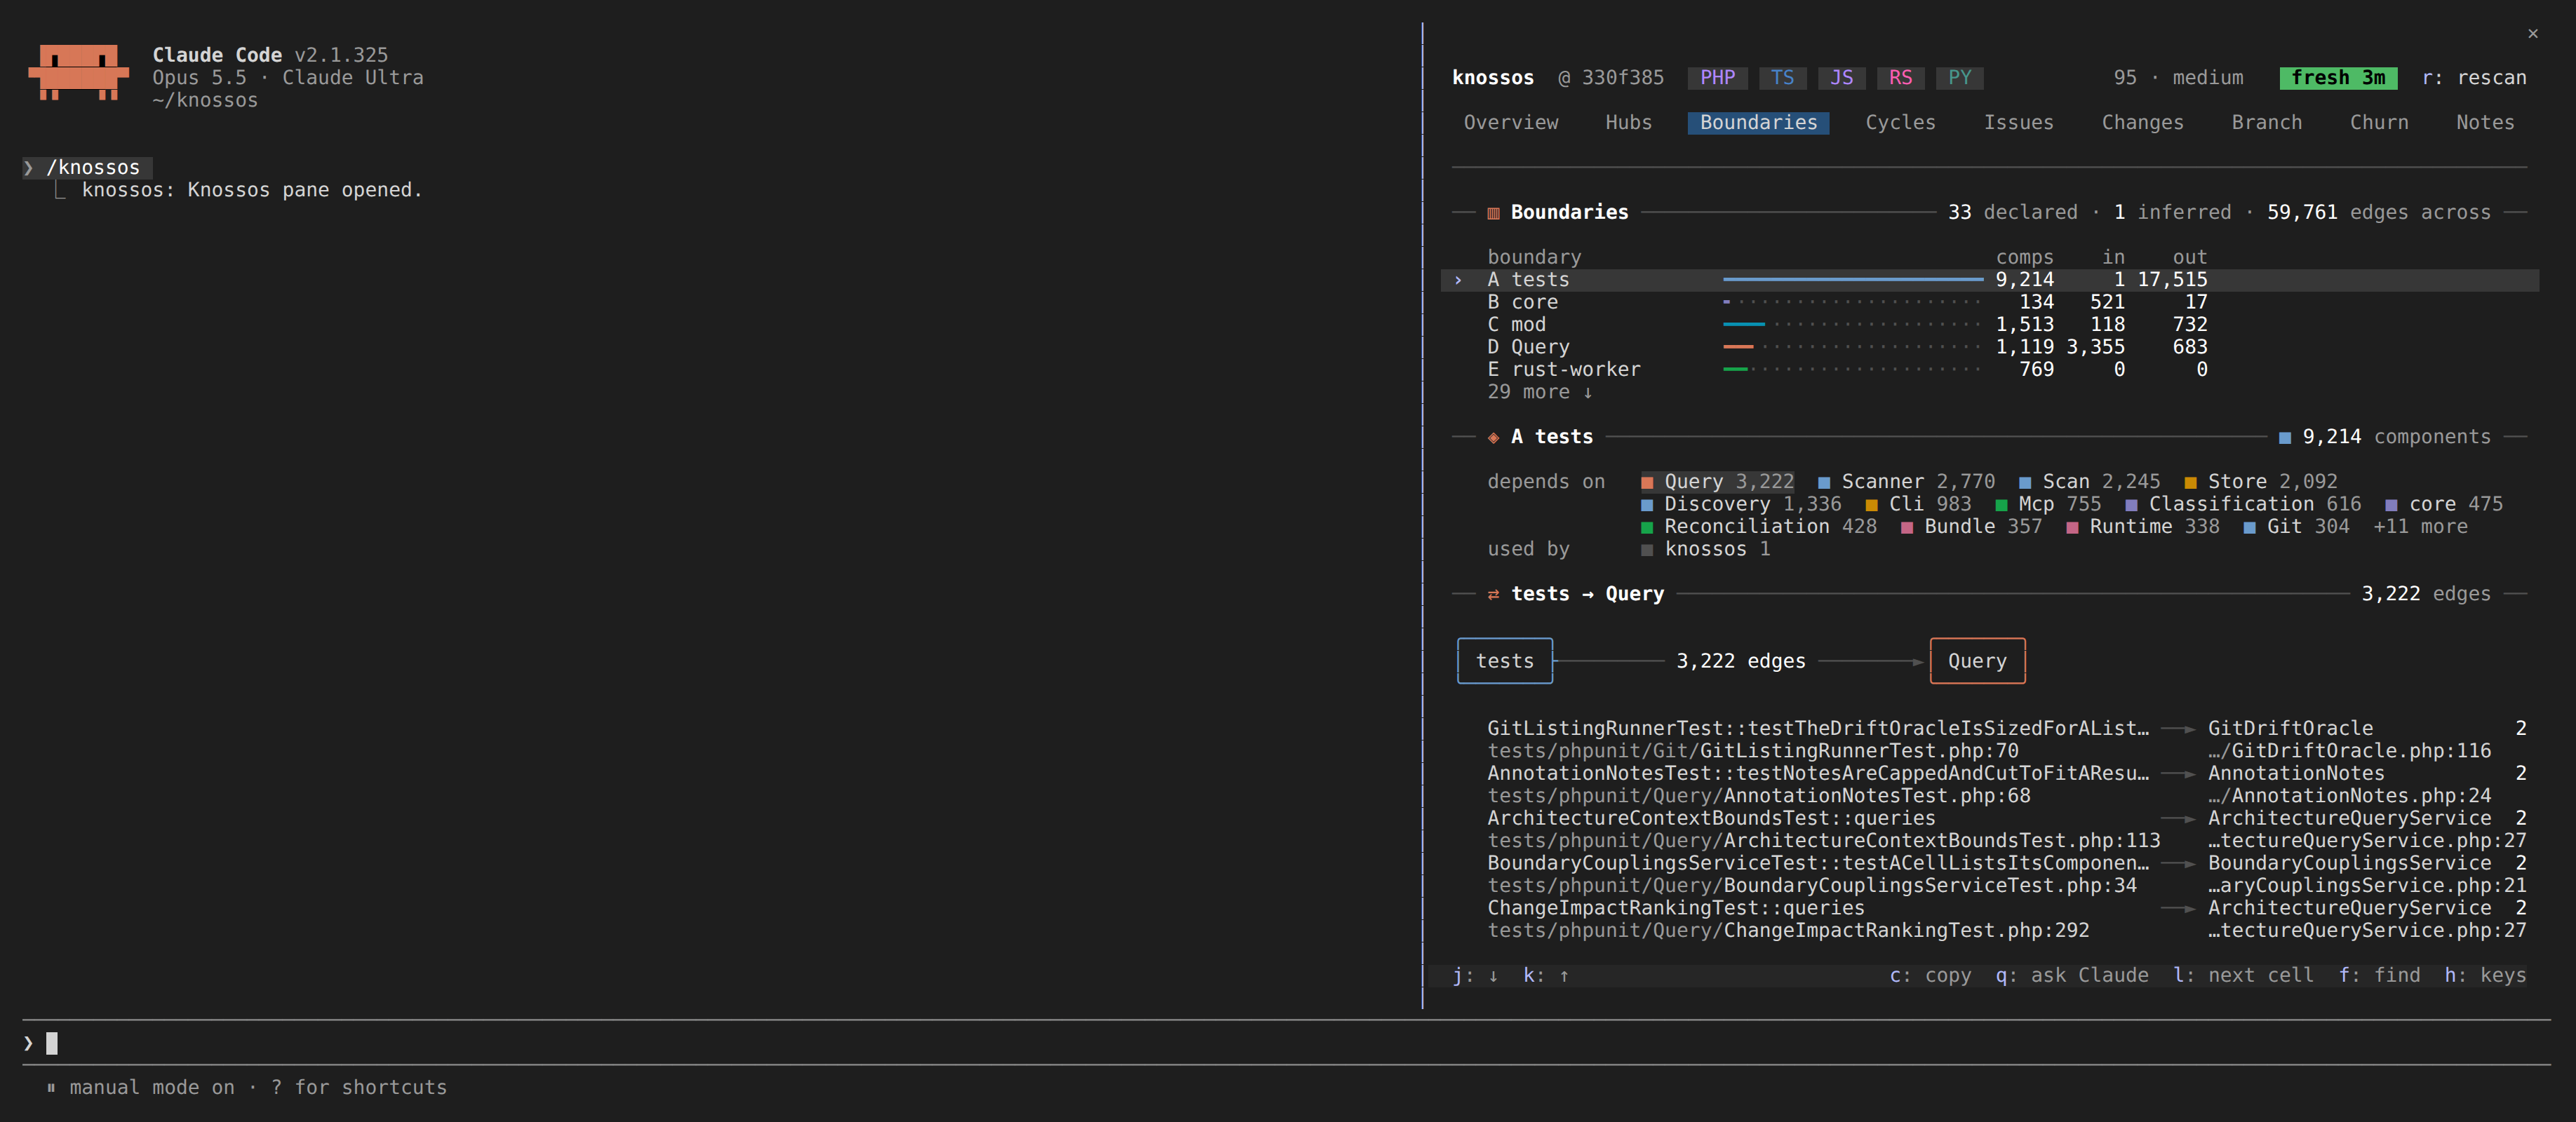
The heat map shows how much each boundary depends on each other one. Rows are where a dependency starts, columns where it lands. The axes are lettered, and the row labels spell the letters out.
- A cell's shade is the number of dependencies on a log scale of the busiest cell, in four steps of the accent colour. The legend under the map reads
fewer … more edges. - A faint
·means nothing crosses. ×in the error colour marks a pair a declared policy forbids while nothing crosses it. Once something does, the cell is an error tile.- The marked cell is a solid tile in the text colour.
On the terminal the map is a grid of solid tiles in your theme's colours. Elsewhere it is drawn as shades from ░ to █. With rows to spare, each cell grows to two or three rows tall and stays square.
Per boundary lists each boundary with comps (its components), in (the dependencies from other boundaries into it) and out (its dependencies into other boundaries). A component counts in one boundary, the one the pane labels it with.
The tab lists every boundary that labels at least one component, and its title counts them the way the Overview tile does: 28 declared · 6 inferred is the boundaries you declare and the inferred ones that label the components none of yours covers. An inferred boundary whose components all sit in a declared one labels nothing, so it is not listed and not counted. Without an inferred one the title reads 28 declared, and without a declared one 6 boundaries. A figure with + is a floor: there were more than the dashboard names. When the pane is narrow, the edge count goes before the boundary counts do.
j and k mark a boundary, and two cards spell it out:
- The marked boundary: what it depends on and what depends on it, each with its count, and the boundaries a policy forbids it to use.
- The marked cell: the boundary's row, in the column of what it depends on most. A box for each boundary, the arrow between them with how many dependencies run that way, and under it the five component pairs that make up most of them, each side named as the rest of the pane names it (a method by its class and name), with a line under each pair saying where its two sides are declared (
views.py:12 → Client.php:40).
Past twelve boundaries a heat map can no longer be read, so the tab draws none. Boundaries lists every one with the same columns, its note counting them and their dependencies, and the marked boundary and its cell sit beside it on a wide pane, under it otherwise. The dashboard holds up to a hundred boundaries. However many boundaries the marked one touches, each of its lines takes at most three rows and counts the rest (+40 more).
l moves the cell to the next boundary the marked one depends on, as does a press on one of those boundaries. A boundary opens nothing; c copies its name and q asks Claude what its dependencies are for.
Cycles
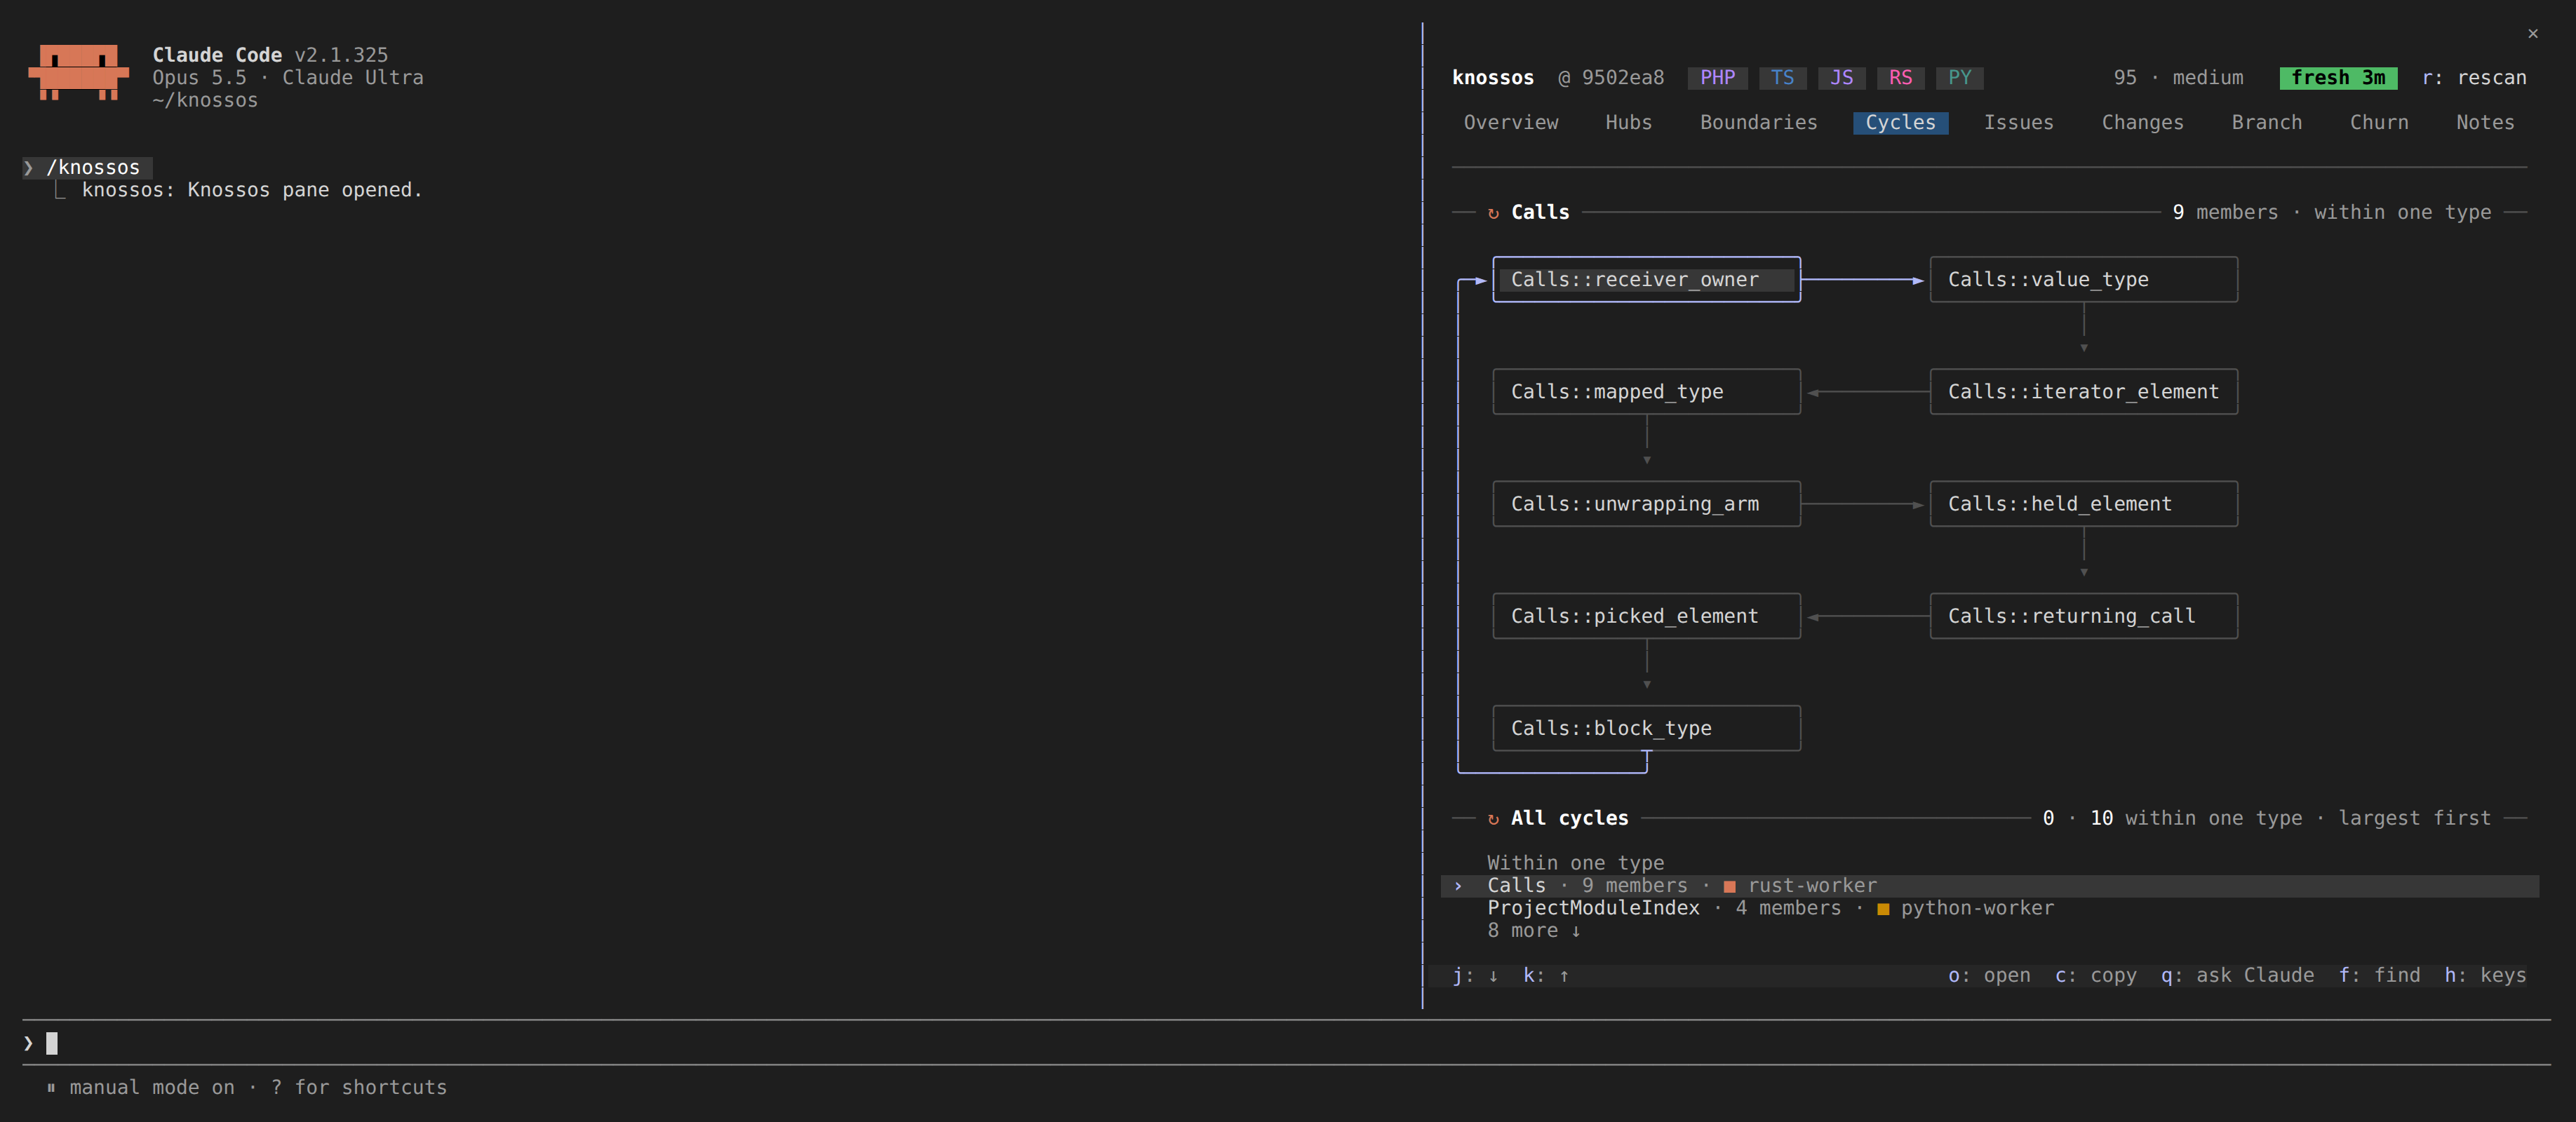
Cycle 1 draws the marked dependency cycle as a serpentine of boxes, one box per member: the first row left to right, the next right to left, an arrow from each member to the next, and a return edge labelled back to the start. Its note says how many members it has.
- A cycle that spans boundaries frames each box in its boundary's colour and marks each hop that crosses a boundary with
╫(╪on a vertical hop) in the warning colour. - The marked member's box is framed in the accent.
- A long cycle folds its middle into one
… 4 more …box: past six members on a narrow pane, ten on a medium one and sixteen on a wide one.oon the fold unfolds it. - Members the dashboard did not list (it lists forty per cycle) close the loop as one
+N morebox. - Below 50 columns, the drawing becomes the chain as text and a member a row.
All cycles lists the ten largest, each with its member count and the boundary most of its members are in. After them, under a Within one type line, come the cycles whose members all belong to one class, such as a tree walk whose methods call each other: each is named by its type (Walk · 3 members) and draws and opens like any other. The heading counts them apart (1 · 2 within one type); only the cycles between types count towards the tile, the toasts, the model's message after a commit and the quality gate.
j and k walk the members box by box in reading order, then on to the next cycle. o opens a member, c copies it, and q asks Claude how to break the cycle.
Issues
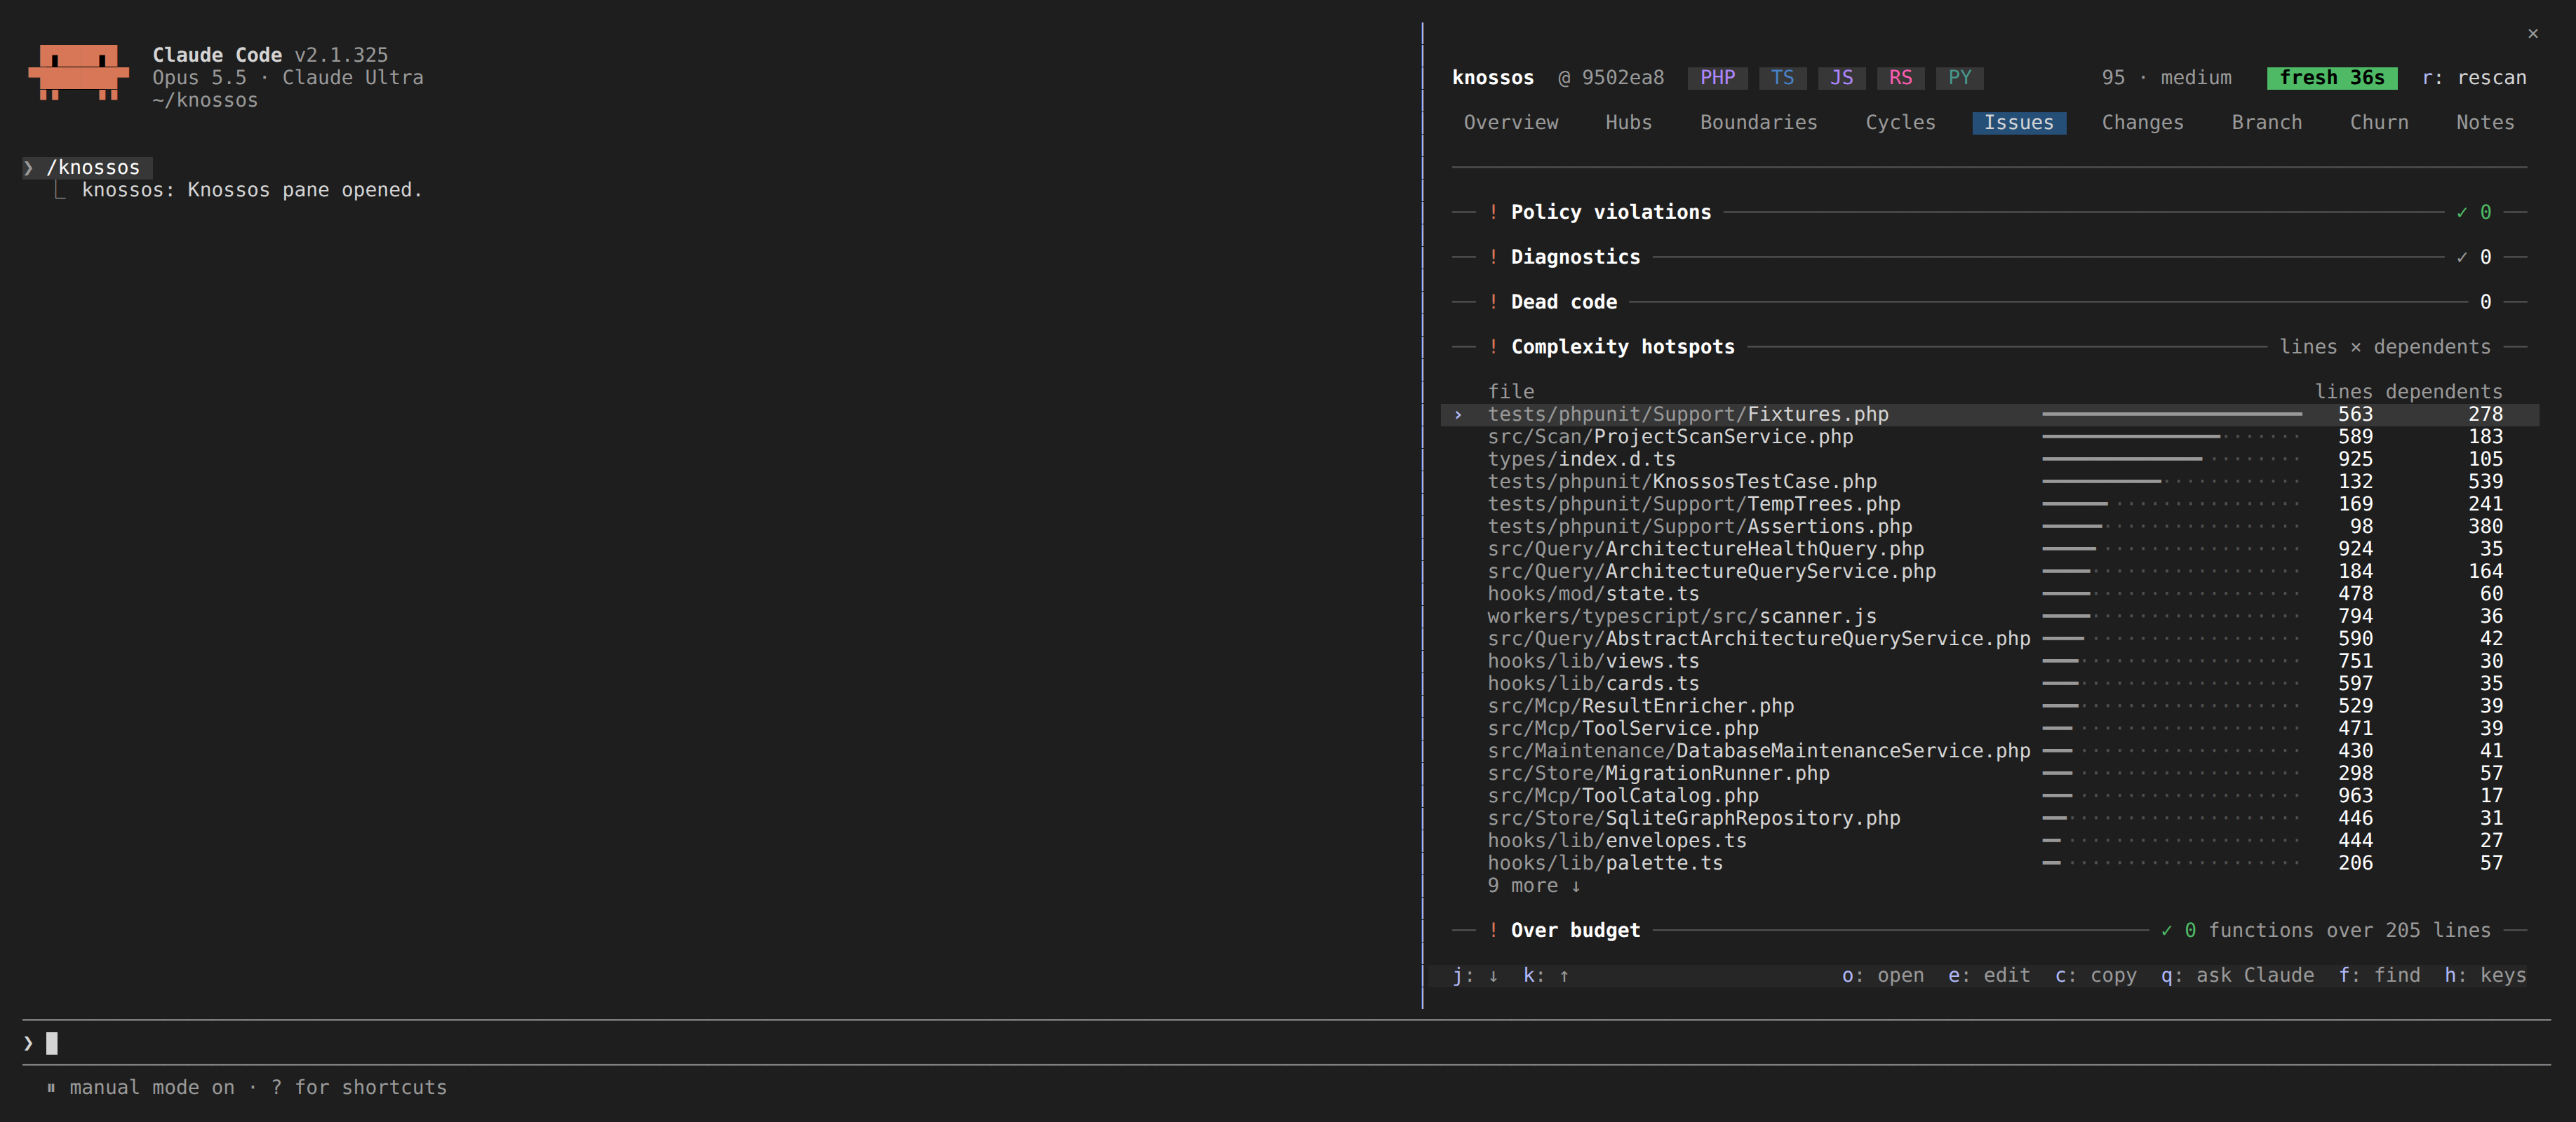
The Issues tab on this repository: a card per kind of finding, each headed by its count, and the complexity hotspots below them.
Issues gathers what needs fixing, one card each, in the order a pane this wide stacks them:
- Policy violations: each declared policy violation, with the offending file and line.
- Diagnostics: the scan's errors and warnings, the first twenty, then
+N more; notes are counted, never listed. Each row ends in its path from the project root and its line, cut from the start where the row is short, then the scanner or enricher that recorded it (· typescript, or· source unknown). A message longer than one line ends in…. The marker walks them:oopens a diagnostic's file andeopens it at its line. A diagnostic about no file only takes the marker:oandedo nothing on it. - Over budget: files with a PHP function longer than the
max_php_function_linesbudget inmaintainability-budgets.json, with how many functions are over and the longest. Its note names the rule (functions over 205 linesin this repository) and reads✓ 0when no file breaks it, andno maintainability-budgets.jsonwithout the file. - Dead code: the first fifty dead-code candidates.
◇marks one only tests reach. See dead-code candidates. - Complexity hotspots: files ranked by their lines times their dependent files, with a bar of that product beside the two figures.
A card with nothing to list is one line (── ! Policy violations ──── ✓ 0 ──). The tab's badge counts violations, errors and warnings. o on a hotspot or a file over budget opens the file's detail, and e opens the file at its longest function.
Changes
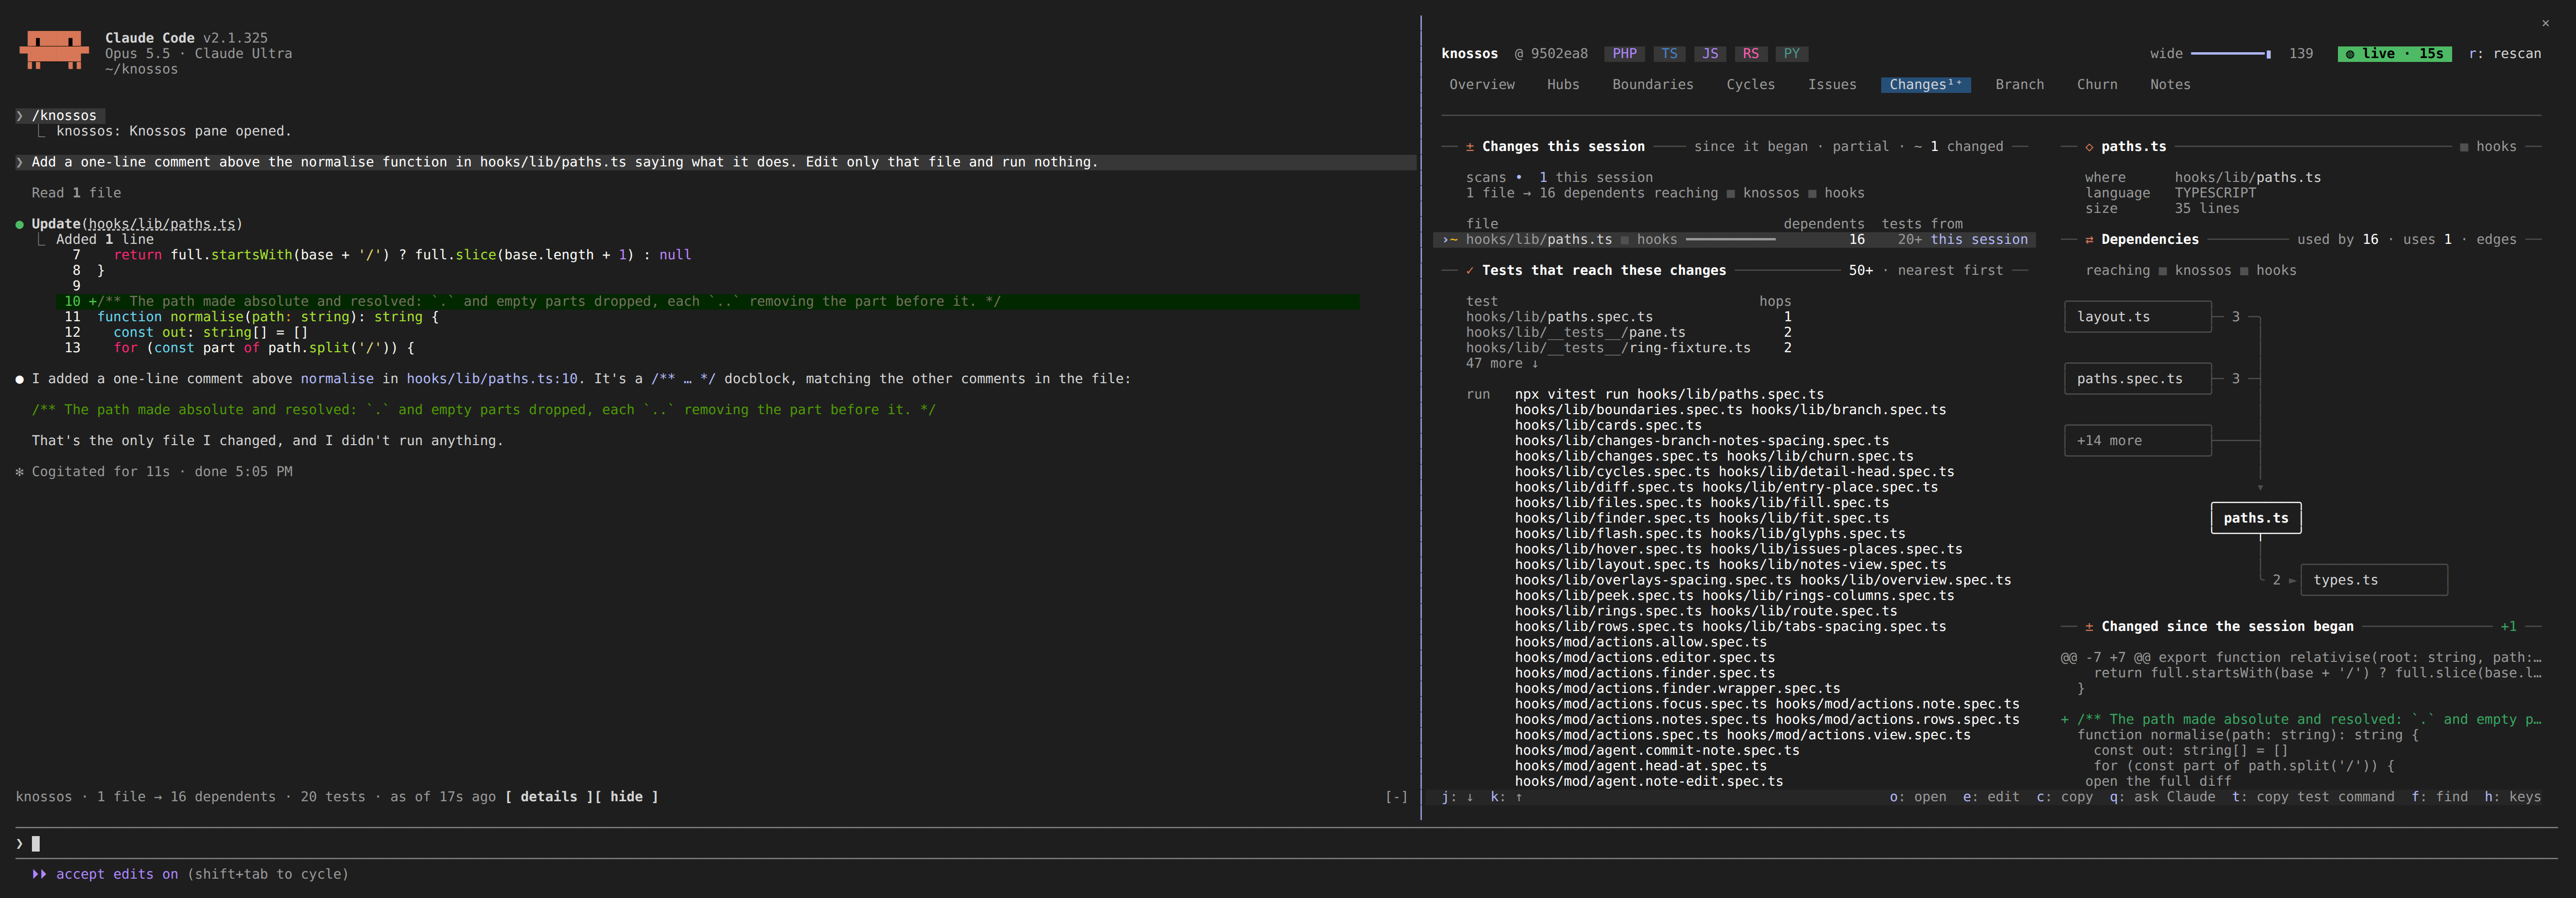
Changes lists everything that changed in the project since the session began, whoever changed it: the session's own turns and subagents, your editor, a checkout.
Changes this session heads with the session's scans as a row of dots, oldest first: in the accent for a scan that took in the session's own changes, dim for one that took in changes made outside it, then how many of each. Under it, the files, their dependents and the boundaries they reach, and in the warning colour how many files no test reaches.
▲ N files no test reaches counts the files that knossos knows no test reaches. The count is a button, as is u. It lists only those files, the marker on the first, and the line then reads ▲ N files no test reaches · showing only these. Pressing it again, u, or the show all files row under it lists every file, the marker kept on its file. The list shows every file again after a /clear, and once no file is left that no test reaches. ▲ N policy violations introduced is a button that opens Issues on its first violation. When no test reaches the changes at all, the tests card's ▲ no test reaches these changes lists the files no test reaches in the same way.
Each file row has:
| column | meaning |
|---|---|
| mark | + added, − deleted, blank for a changed file |
| boundary | the boundary the file sits in |
dependents | how many files depend on it, with a bar (deps on a narrow pane) |
tests | how many test files reach it; ▲ none when none does, 20+ at the cap, blank when unknown |
from | this session or outside |
Tests that reach these changes lists them nearest first, then the command that runs them, chosen from their paths:
| test files | command |
|---|---|
*Test.php | vendor/bin/phpunit <file>, or --filter '(A|B)' for several |
*.spec.*, *.test.* scripts | npx vitest run or npx jest, as the nearest package.json says |
test_*.py, *_test.py | python -m pytest |
*_test.go | go test per package |
| Rust files | cargo test |
A script whose runner the project does not make plain is left out of the command. Several runners are joined with &&. When your session sits below the project's root (inside an ancestor project), the command starts with cd <project root> &&. t copies it.
o opens the marked file's detail, with its diff, and e opens the file. On a wide pane the marked file's diff stands beside the list as text, cut short; its last row, open the full diff, opens the same detail as o, where the diff is drawn across the pane.
Where the list comes from
While the live watcher runs, the list comes from the scan ledger, which every scan of the project writes to, read again after each scan. It holds at most 200 files and 50 tests, and the dot row the newest 60 scans.
When the ledger cannot reach back to the session's start, the tab says so, lists what changed since the oldest point it still answers for, and puts that time in its note (since 2026-10-04 09:14). A session that began among the older scans the ledger keeps merged lists what changed after it and says its start is approximate.
With no watcher (switched off), the tab adds up what the session's own turn briefs reported, and says so. That list keeps at most 500 files and 500 tests, and says partial past that.
this session or outside
A shell command (sed -i, git mv, a formatter's --write) edits files as surely as the edit tools do, so whose a change is depends on when it was made. The mod keeps when each of the session's tool calls ran, in the main loop and in every subagent. A file is this session's when the session's Edit, Write or NotebookEdit wrote it, or when a scan took it in while one of the session's calls was running.
Calls that only read or wait do not count: Read, Grep, Glob, file_context, and Agent, AskUserQuestion, TaskOutput, TaskStop, Monitor, SendMessage and the plan-mode tools. A change made while the session waits on someone is yours.
Two consequences follow. A change you make in your editor while one of the session's calls runs counts as the session's. A command started in the background counts only while the call that started it runs.
A session continued in a new process (claude --continue or --resume) reads its start back, so Changes and the diffs still count from where it began. Which changes its tools made is known only to the process that saw them, so in a new process the earlier ones read outside.
Branch
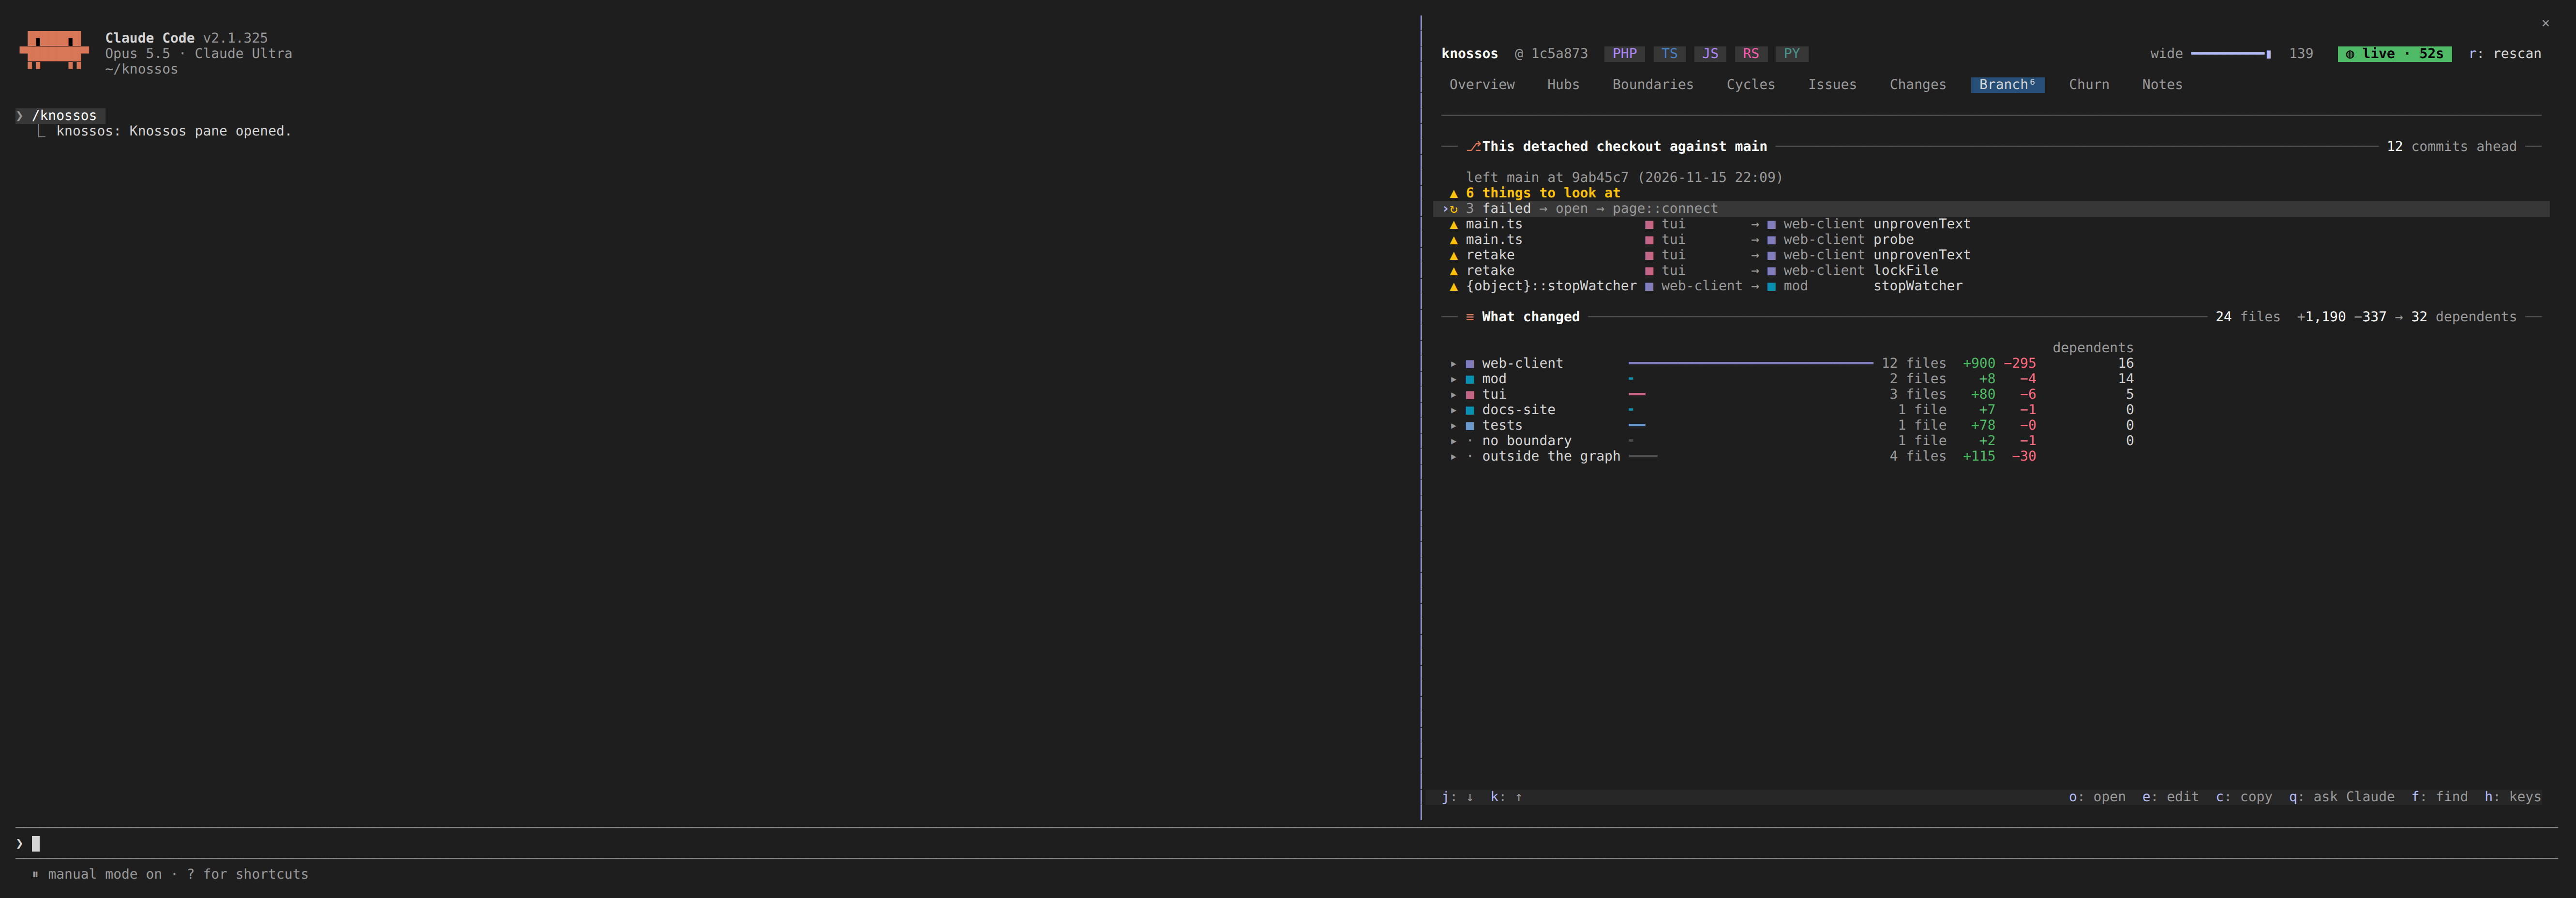
Branch answers two things at a glance: what this branch changed against its default branch, and whether it broke anything.
The first card names the branch against its default branch, how many commits ahead it is, and where it left (left main at fd13714). Git finds the default branch (the one origin/HEAD names, else main or master) and the merge base, locally. The tab compares against a retained snapshot taken at that commit, else the nearest one before it, and then says how many commits earlier that was. When none near the merge base is retained, it says so in the warning colour, and compares against the oldest snapshot after the merge base, saying how many of the branch's commits that snapshot already holds, since their changes do not show. On the default branch itself, or without git, the card says that instead.
Under that, the verdict. When nothing broke it is one line: ✓ no new cycles ✓ no new crossings ✓ no hubs grew ✓ no dead code ✓ no violations (the last only when the project declares policies). When something did, it says how many things to look at, then a row for each, the worst first: policy violations, new cycles, dependencies newly crossing from one boundary into another, hubs at least ten depend on that more depend on than before (20 → 31 +11), and new dead code. Past the first eight of a kind it says how many more are not listed. A policy check that stopped at its edge or time limit is never all clear: the count reads as a floor (3+ things to look at, or policies not fully checked when it found none) with a line saying the check stopped. When the project's knossos.json cannot be read, the verdict claims no no violations and says policies unreadable: with the reason. Every finding opens its component. The comparison is read when the tab opens and again for each new snapshot.
What changed totals the files the branch's commits touched since the merge base, their lines and how many files their changes reach (7 files +45 −6 → 61 dependents), then lists them by boundary: a row for each, with a bar for its lines, its files, its lines and the files it reaches (the dependents column), each counted once. The boundary that reaches most comes first, the files outside the graph (docs, lockfiles) last; files the graph holds that no boundary claims form a row of their own, no boundary. o on a boundary unfolds its files under it, each with its lines and dependents, and o on a file opens it. It needs no snapshot, so it still lists when the comparison cannot be made. Uncommitted edits are not in it: the Changes tab has those.
Churn
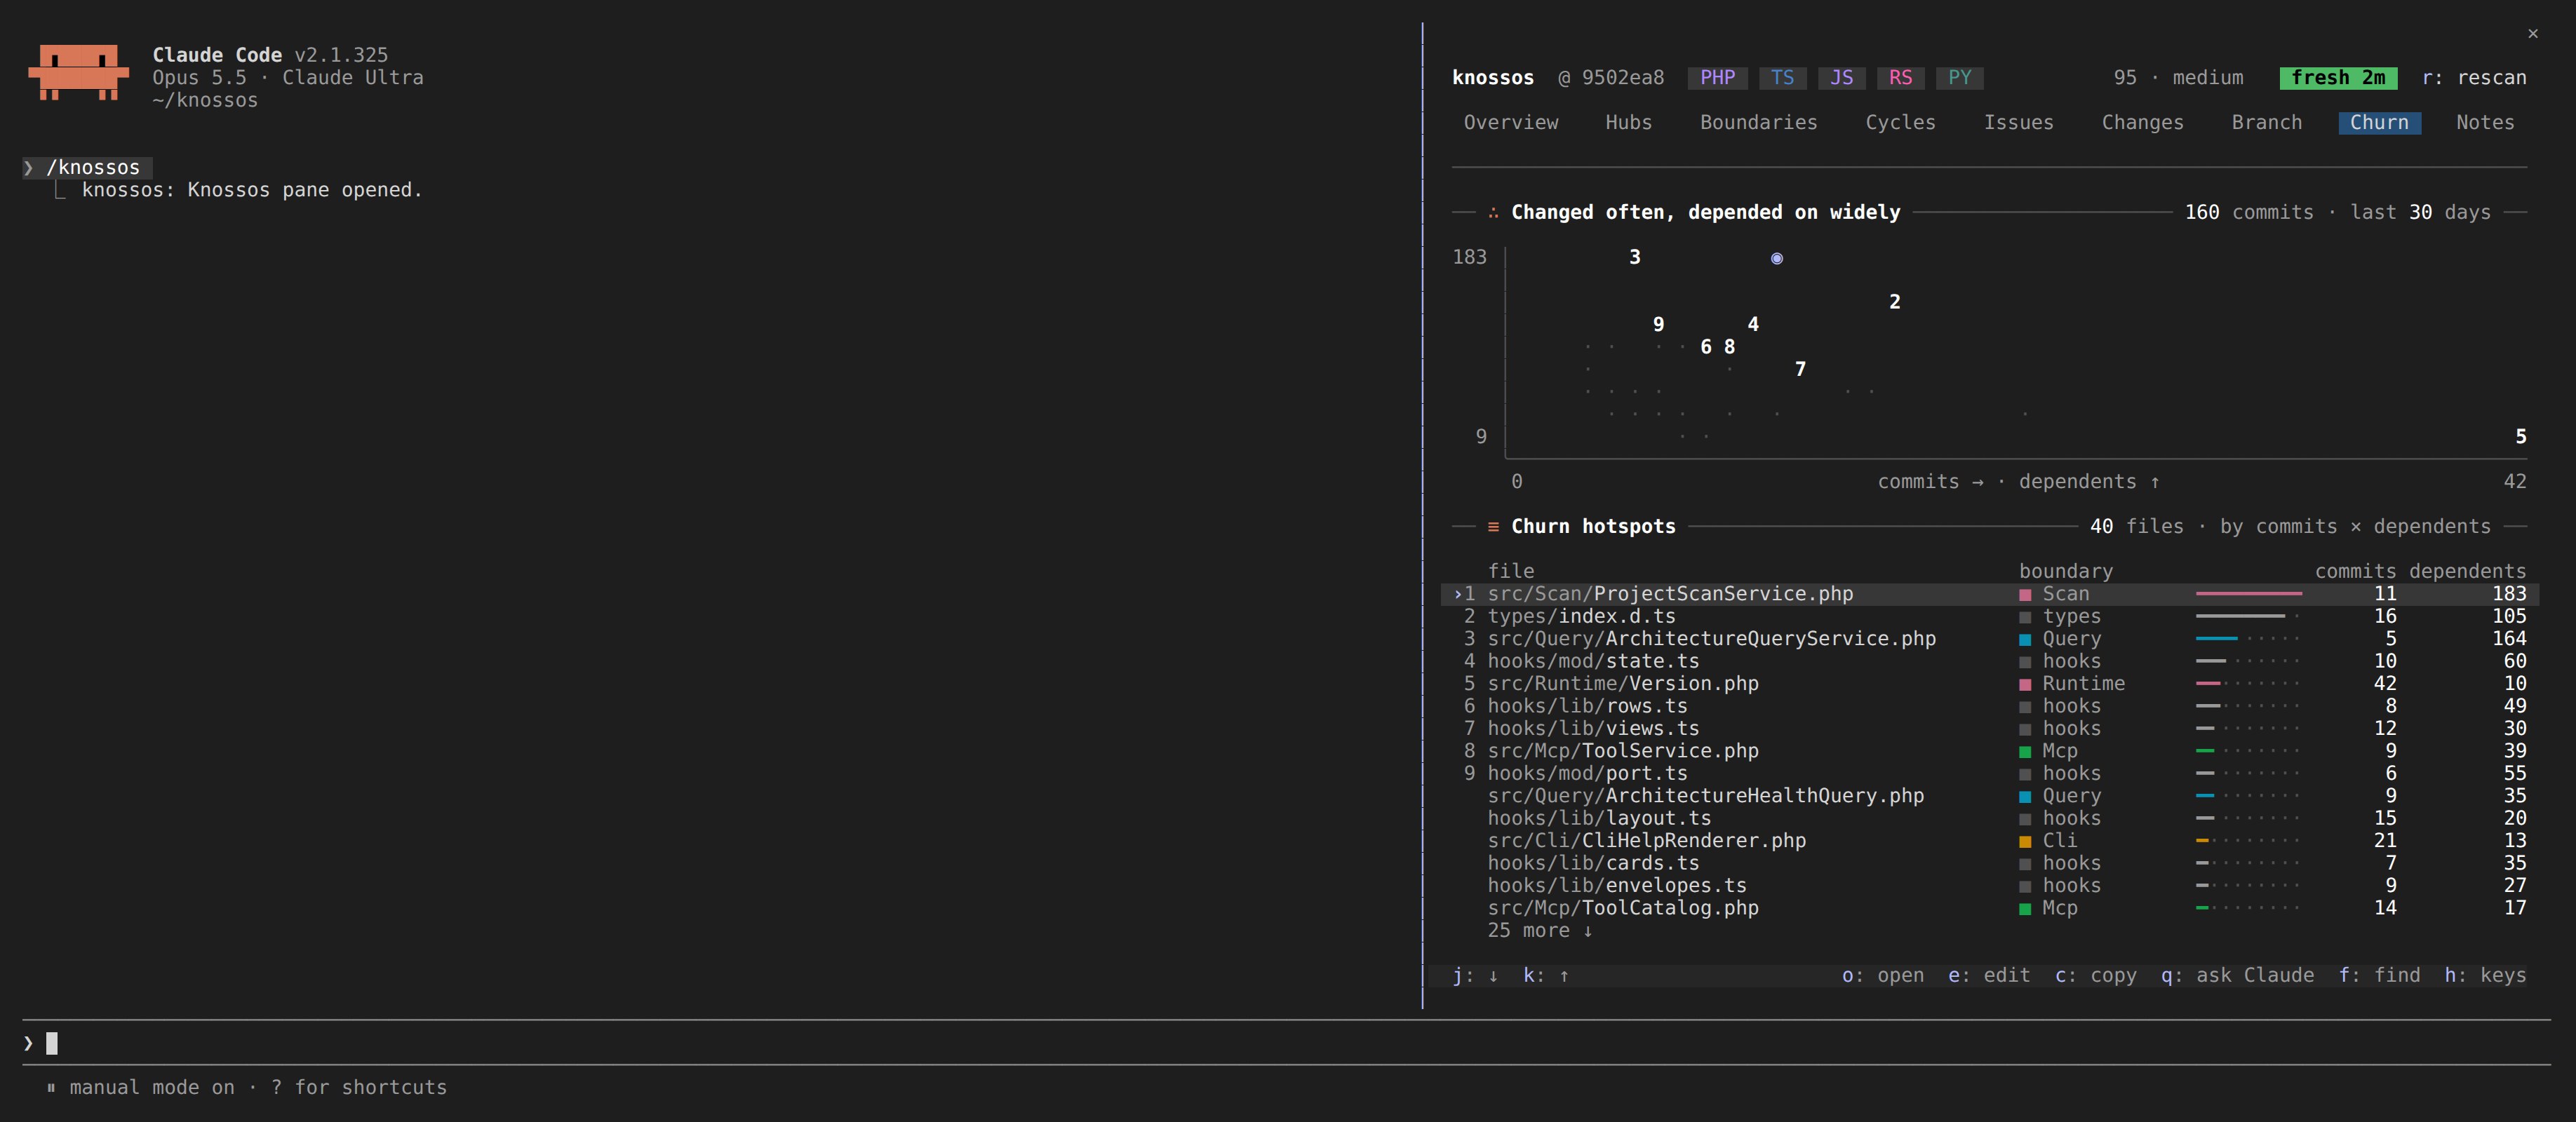
Churn ranks the files changed most often in the last thirty days that much of the project depends on. A file's score is its commits in the window times the files that depend on it.
Changed often, depended on widely is a scatter of every listed file: commits across, dependents up on a log scale from the fewest listed to the most. The nine highest scores are drawn as their rank digit, and the marked file as the accent dot. The note says how many commits were read.
Churn hotspots is the ranked list, at most forty files: each with its rank (for the top nine), its boundary, a bar for its score, its commits and its dependents. o opens a file's detail.
The tab reads one git log, at most 500 commits and three seconds. A log too large to read whole is read again over the last 50 commits and marked cut. It is read again when the checkout moves to another commit, not on every scan. Without git the tab says so.